Bitcoin analytics
Historically in Bitcoin, green periods have been good times to buy and red periods have been good times to sell.
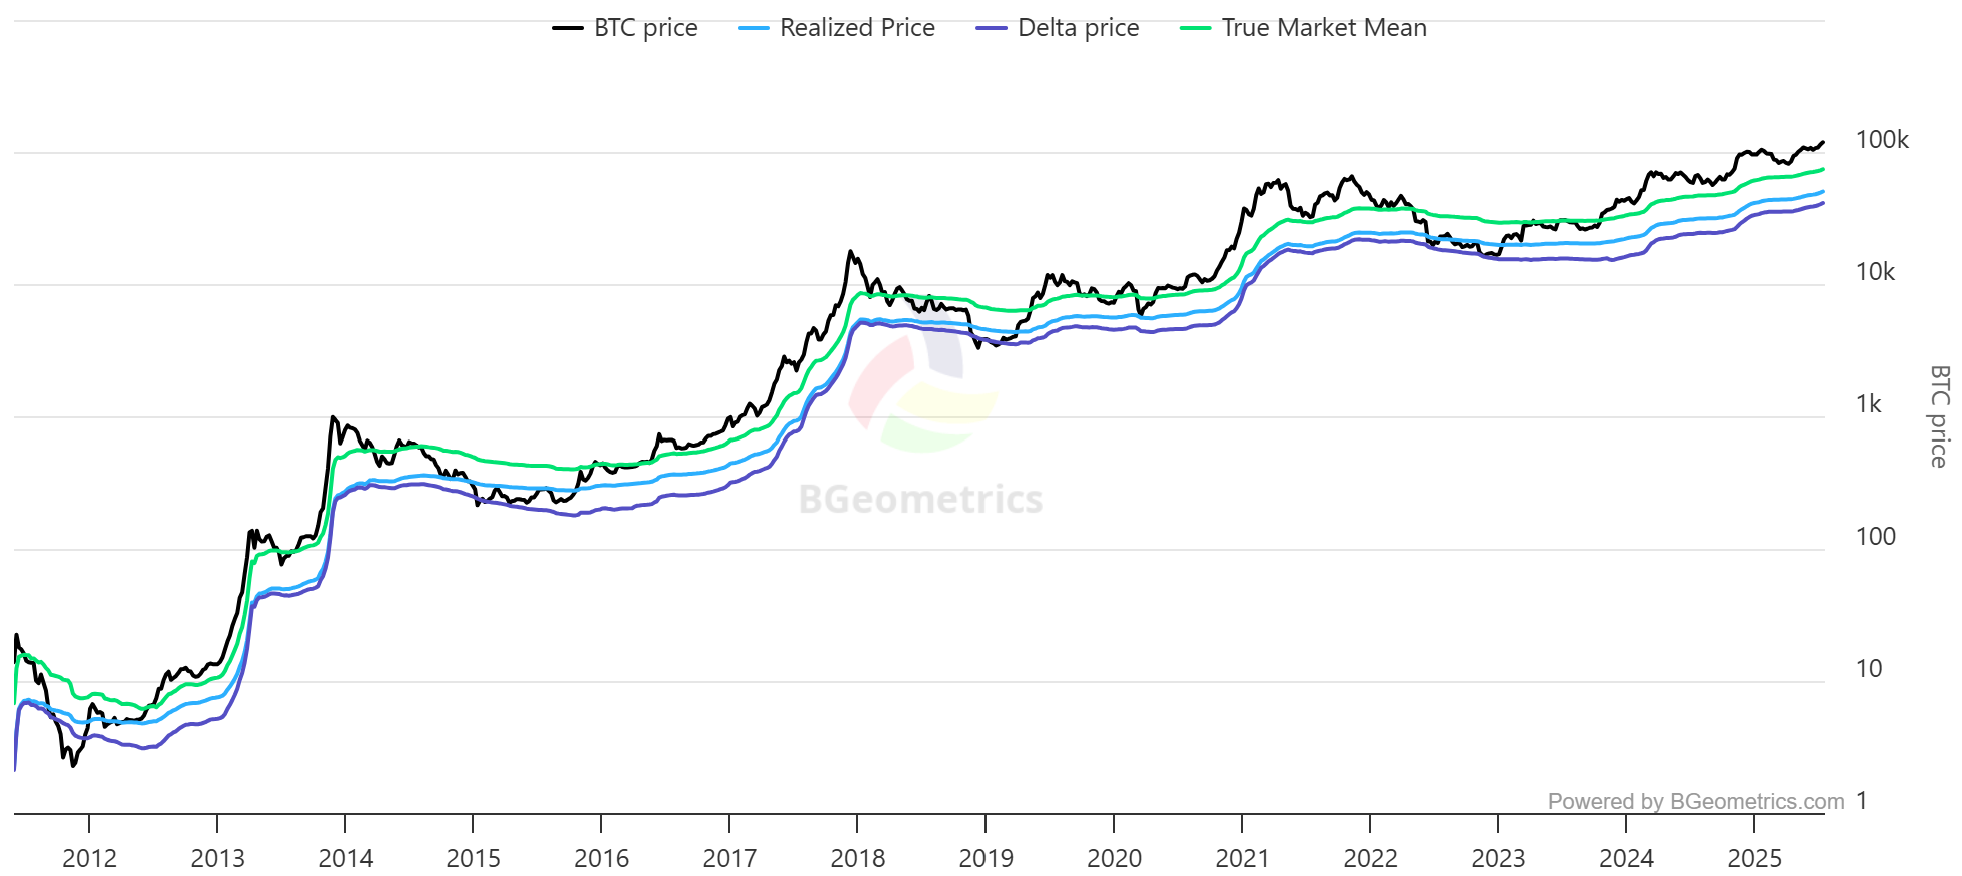
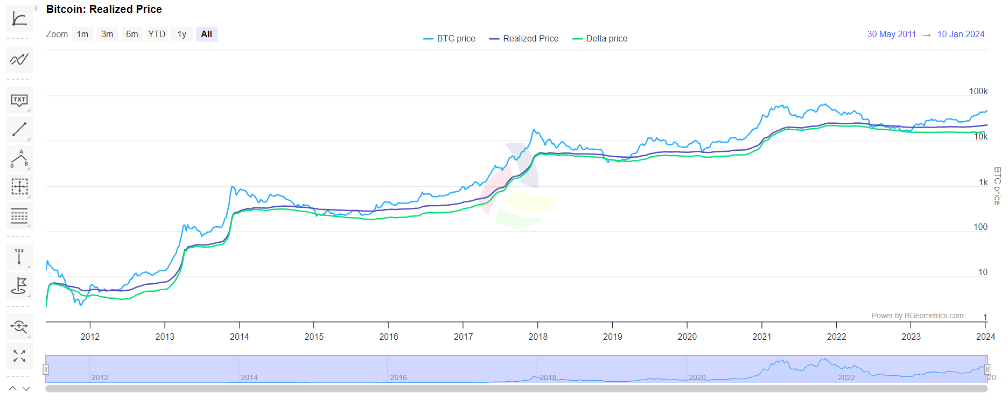
Bitcoin Realized Price
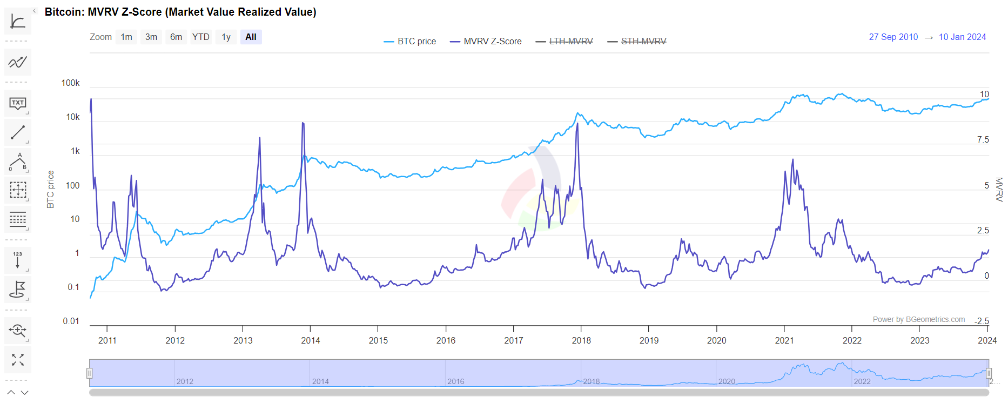
Bitcoin MVRV
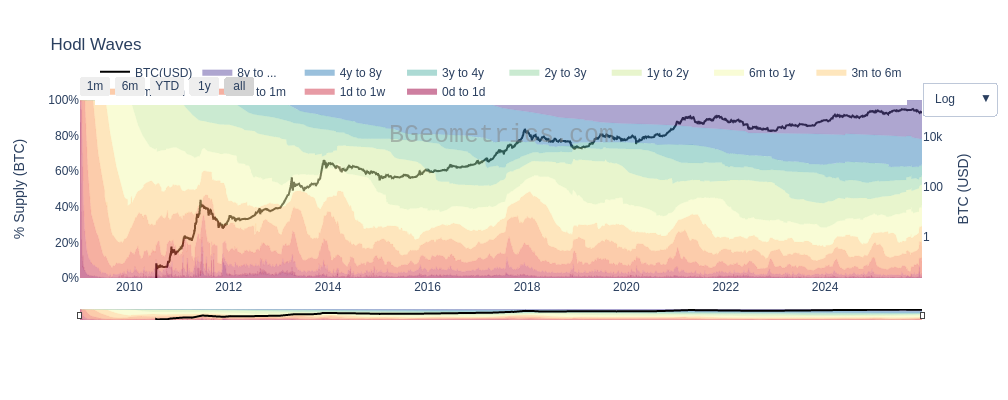
Bitcoin Hodl Waves
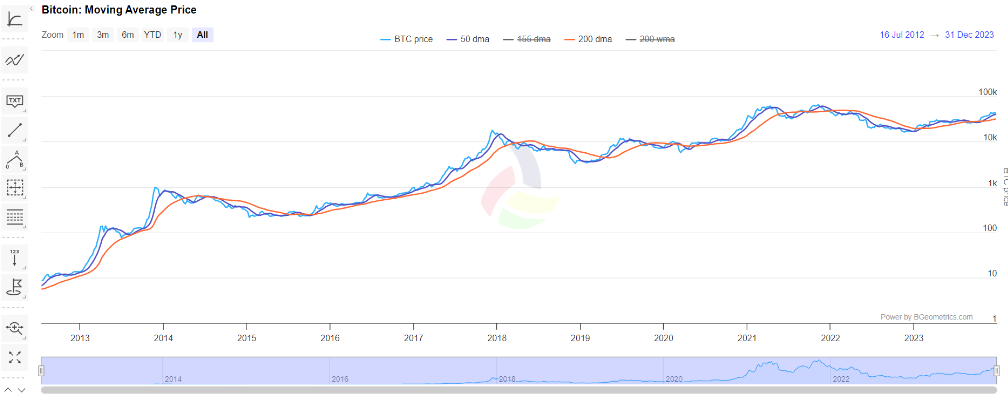
Bitcoin Moving Average
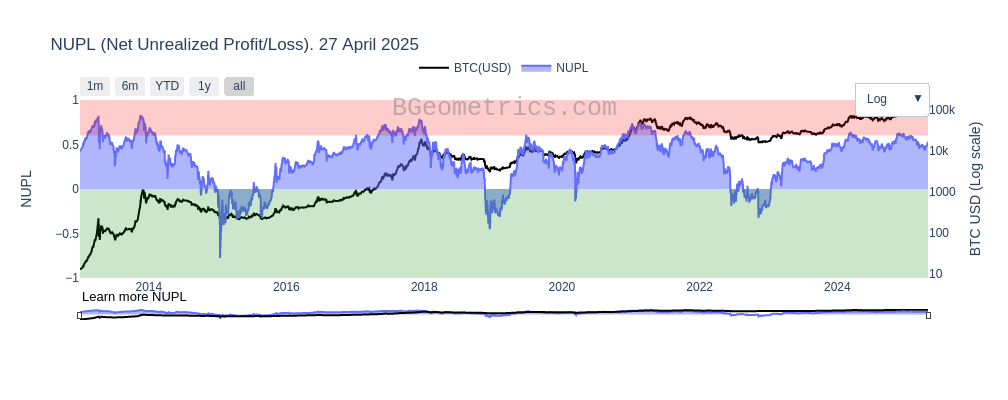
Bitcoin NUPL
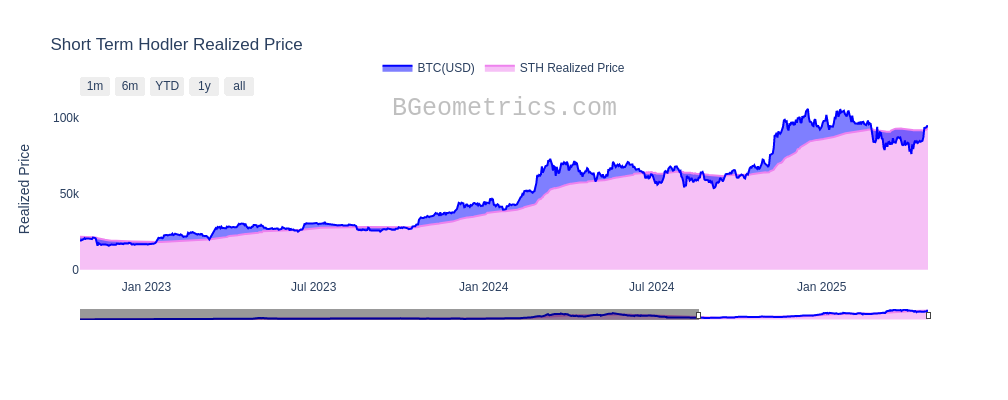
Bitcoin STH Realized Price
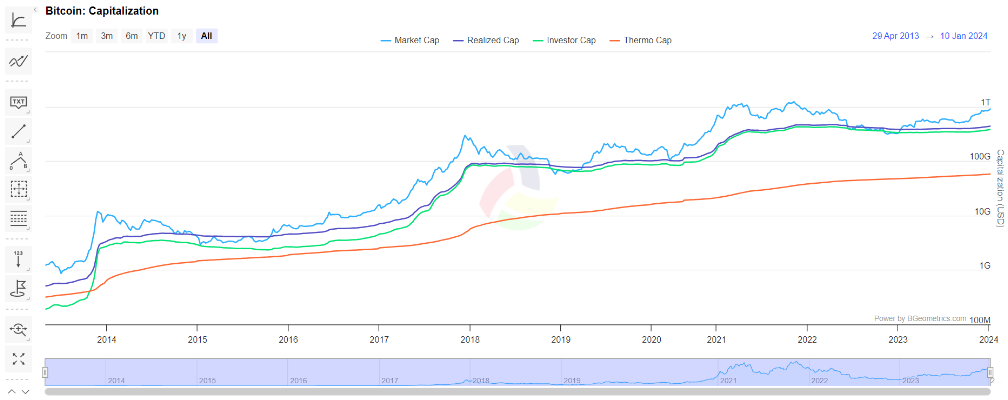
Bitcoin Capitalization
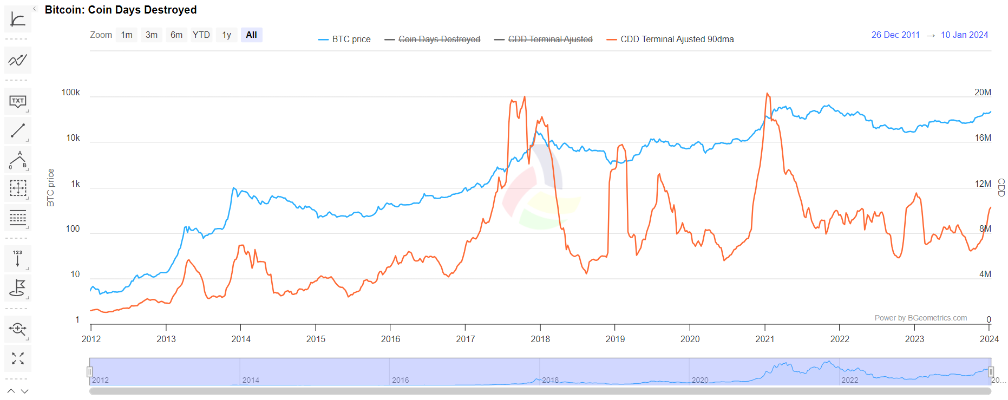
Bitcoin Coin Days Destroyed
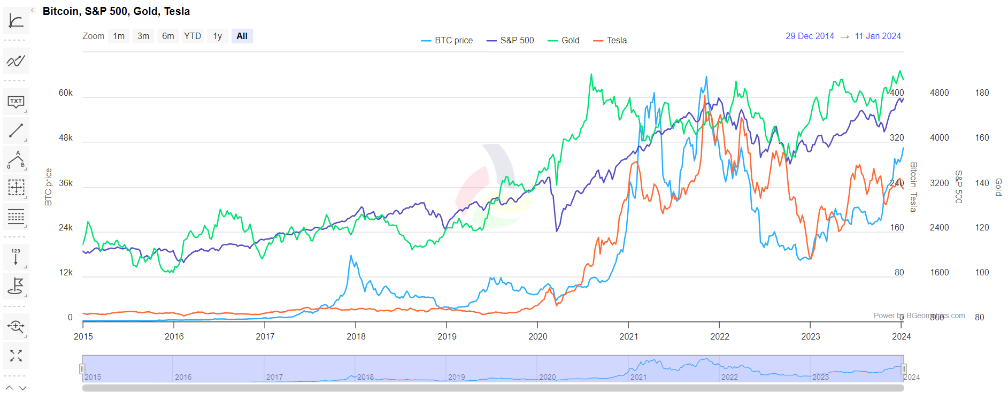
Bitcoin and S&P 500
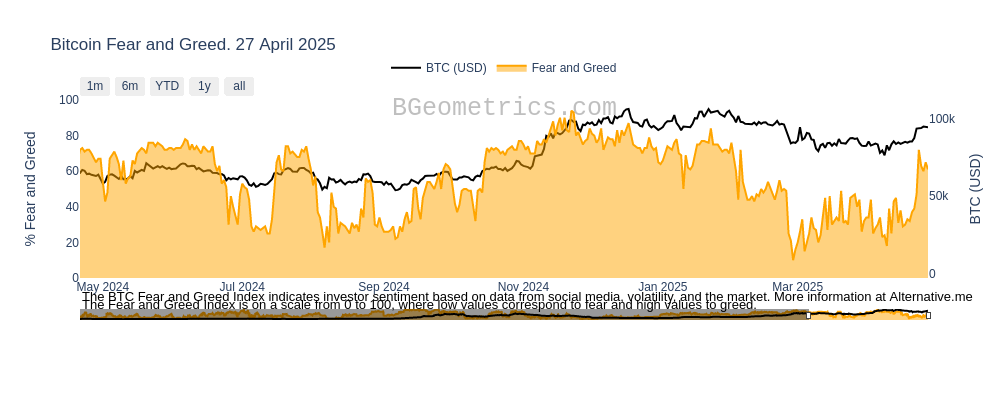
Bitcoin Fear and Greed
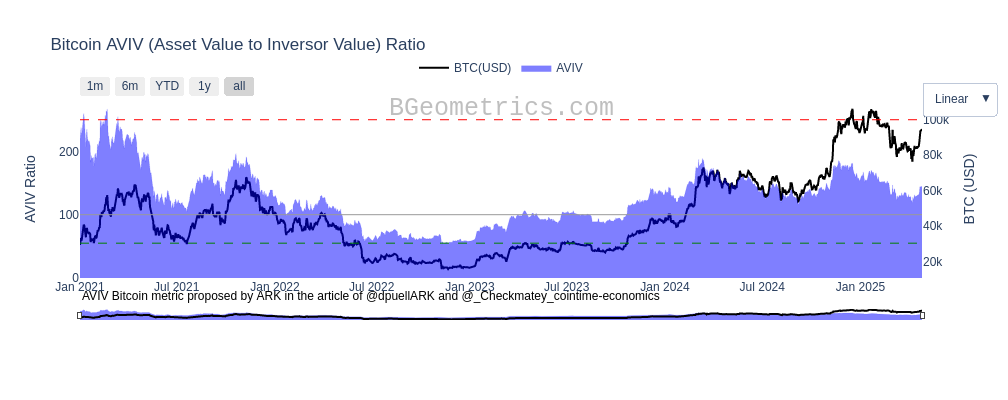
Bitcoin AVIV
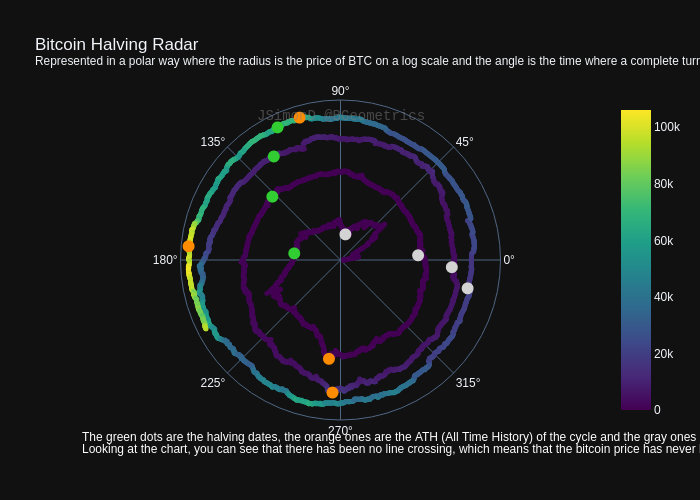
Bitcoin Price Radar Chart
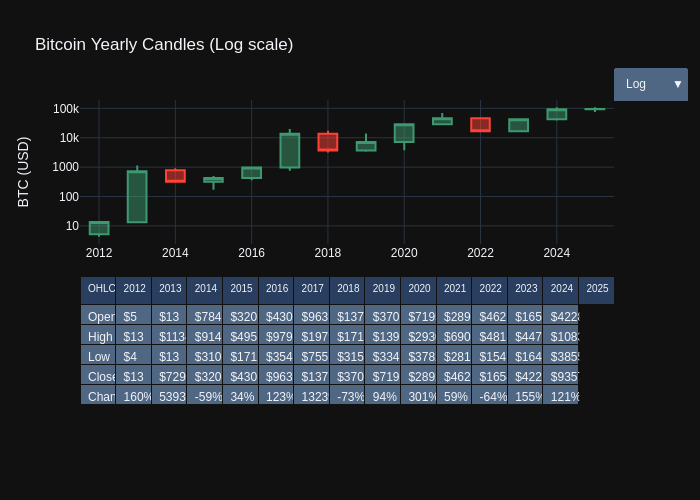
Bitcoin Candles Yearly
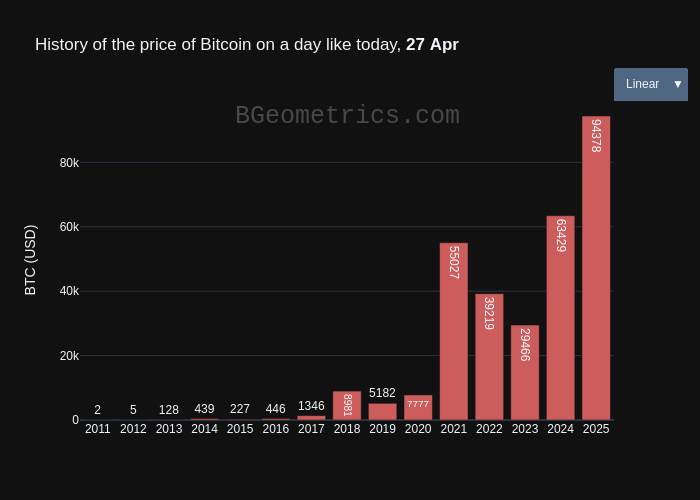
Bitcoin on a day like today